The following example demonstrates how efficiently HTflux can be used to calculate precise thermal key figures of an inhomogeneous construction element, e.g. a timber-frame wall. Not only will the thermal transmittance (U-value) of the wall be calculated, but also the dynamic thermal performance figures.
The model
We examine the thermal performance of a commonly used timber-frame wall construction.
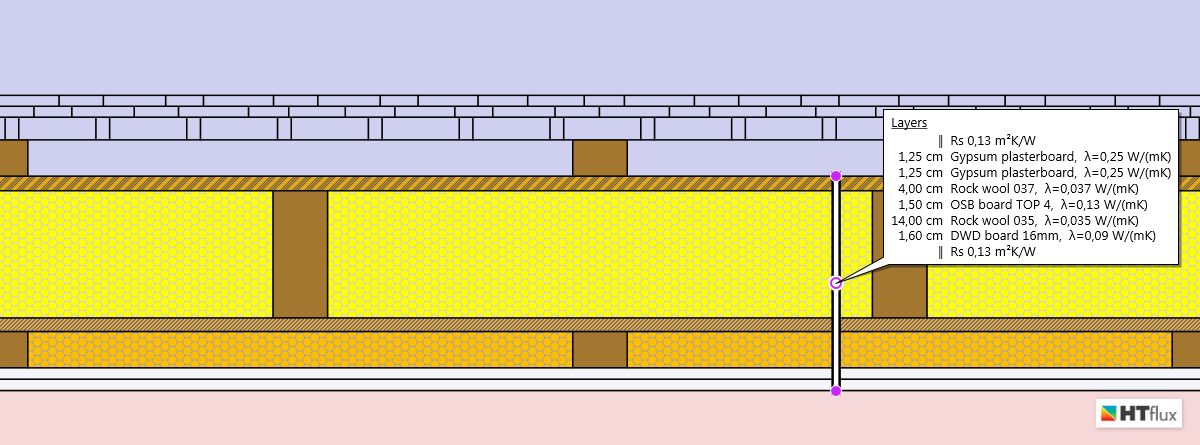
The core of the wall consists of solid wooden wall studs (6 cm) with a filling of mineral wool insulation between them (60 cm). Two wood-based panels are mounted on either side. The plywood/OSB board is also used as vapor retarding layer, whereas DWD panels, being very open to diffusion, serves as external layer. On the exterior side wood shingles are illustrated, however any type of facade can be assumed, as the thermal simulation will end at the ventilation layer (according to the standard-calculation method). On the inside a double gypsum plasterboard layer mounted on timber battens forms the interior wall surface.
Dynamic thermal characteristics (according to ISO 13786)
Using HTflux you can easily calculate dynamic thermal key figures like the thermal admittance Y11, the periodic thermal transmittance Y12, the areal heat capacity (thermal mass) and the relevant time shifts. Currently these figures are mainly used to prove or optimize the behavior of buildings regarding summer overheating. Recently there is a growing interest in these figures as they could help to increase the energy efficiency of buildings.
Comparison between analytical calculation (plane, „1d“) and detailed 2d-simulation
For inhomogeneous constructions (not consisting of plane homogeneous layers only) the thermal transmittance and thermal figures can be calculated using simplified procedures as described in ISO 6946 and ISO 13786 respectively. However in cases of an inhomogeneous construction, like a timber-frame element, these methods provide only estimates and both standards recommend the use of thermal simulation to get more precise figures.
The deviation between the simplified (1d) calculation and the calculation based on thermal simulation vary from ‘significant’ to ‘negligible’, depending on the specific geometry and the thermal conductivities of the materials used. In general the deviation will become high as soon as highly conductive parts (e.g. concrete or metal) are involved. In the case here the difference is limited as the thermal conductivity of wood is comparatively low and therefore close to the one of the insulation material.
Thermal transmittance (U-value, R-value)
With only 4 mouse clicks you can setup the U-value measurement in HTflux that will provide you with the “true” U-value, based on the actually measured heat-flux. Just make sure that you define a section of the wall that represents its inhomogeneous setup. This means you will have to select precisely one or multiple sections of the repeating element of the construction. In this example the section should have a width of precisely 66 cm (or any multiples of that). After launching the thermal simulation, HTflux will provide the thermal transmittance (u-value) or R-value along with other customizable useful information. In our case we will also display the dynamic thermal properties, calculated according to the simplified method described in ISO 13786.
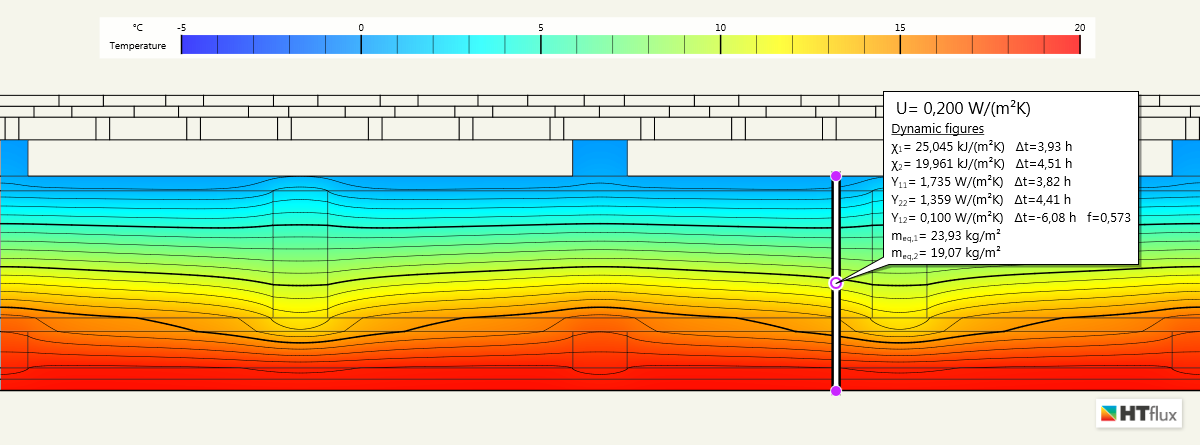
For the wall described above a U-value of 0,200 W/mK is “measured”. Using the simplified method of ISO 6946 to calculated an estimation for the thermal transmittance we get a value of 0,202 W/mK. The simplified calculation therefore provides a good estimation being only 1% better than the “true” value. As mentioned above, the deviation depends strongly on the conductivities of the materials involved as well as on the actual geometry.
Dynamic thermal characteristics
As can be seen in the temperature view above, HTflux U-value tool not only calculates the U-value, but it is also able to provide dynamic thermal key figures, calculated according to the simplified method described in ISO 13786. The simplified method described by ISO 13786 calculates the areal heat capacity for homogenous material layers and therefore in this example, ignores any studs or battens. In contrast, HTflux is used to calculate the precise value of the areal heat capacity – without neglecting the timber elements. To do this the HTflux transient feature is used to measure the heat-flux going into, and coming out of the wall, when a 24-hour sine-shape temperature swing is considered on either side.
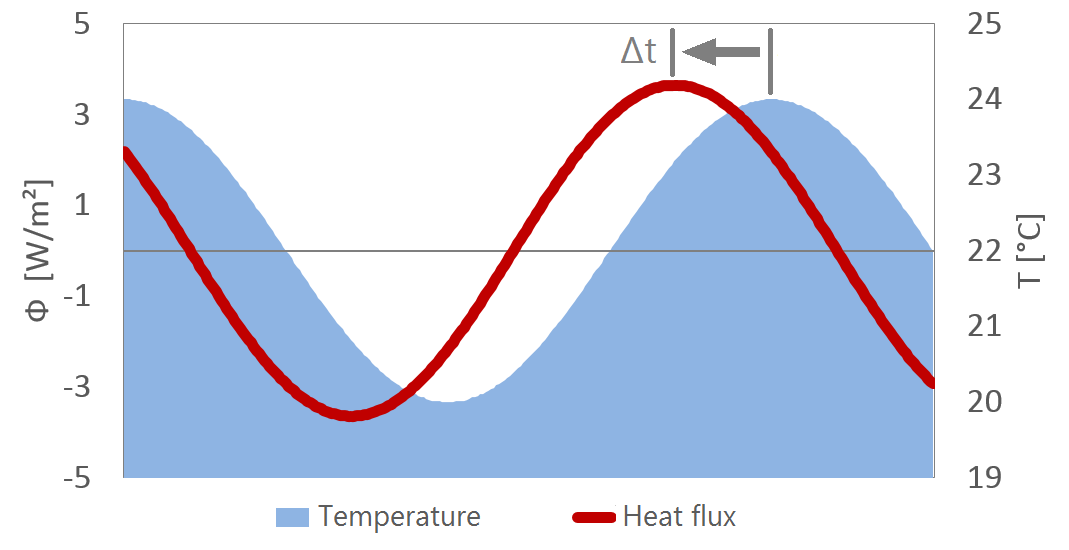
The quotient of the temperature curve and the resulting heat-flux curve can be used to directly calculate the areal heat capacity (thermal mass) of the whole construction, as described in ISO 13786.
Comparing this accurately determined value for the areal heat capacity with the one calculated with the simplified method, we find that the actual value for the internal side of the wall is 4% higher than the estimate. It may seem surprising that the deviation is quite small. The reason for that can be found in the relatively low penetration depth of the 24h heat waves. This means that the periodic heat storage predominantly takes place in the gypsum plasterboard, while only a relatively small fraction of the heat flux reaches the timber battens.
Note: all calculations presented here consider an interior air film thermal resistance of 0,13 W/mK. Some national standards require the calculation of dynamic thermal properties without the air film resistance. In this case the heat capacity as well as the deviation between the two calculation methods would increase significantly. Neglecting the air film resistance is however implausible from a physical perspective.
On the external the heat capacity ‘measured’ is significantly higher than the estimated value (17%). The reason for that can be found in the framing of the ventilation layer (neglected in the simplified calculation), as well as in the fact that a higher proportion of the heat-flux is able to surpass the relatively light DWD board and to reach the massive timber studs. However it is important to note, the higher thermal capacity of the exterior side of the wall has virtually no effect on the indoor conditions.
The transient thermal calculation provides not only a more precise method to calculate key figures, but also gives the possibility to demonstrate the reaction on temperature swings as videos displaying either the temperatures or the heat flux density. The following videos were generated by the HTflux video output feature:
Heat-flux resulting from periodic temperature swings:
Internal wall temperatures resulting from periodic temperature swings:
Comparison:
simplified, analytic calculation vs. simulation
The following table provides a summary of the thermal key figures calculated with the analytic (“1d”) method versus the simulation results.
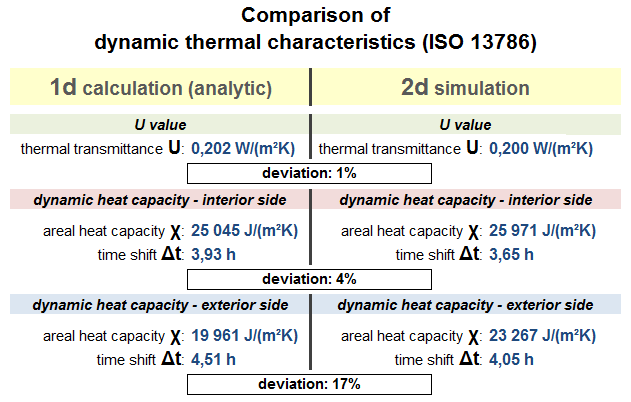
As mentioned before the deviations in this example are quite limited. Significantly higher deviations can be found if materials with higher thermal conductivity are involved.
Appendix – Water vapor diffusion / Glaser 2d
We use this example to point out again, that once you have processed your thermal simulation HTflux enables you to assess vapor diffusion and condensation risk virtually without any extra effort.
The Glaser 2d-simulation shows that considering the given conditions there is no risk of condensation inside the wall construction presented:
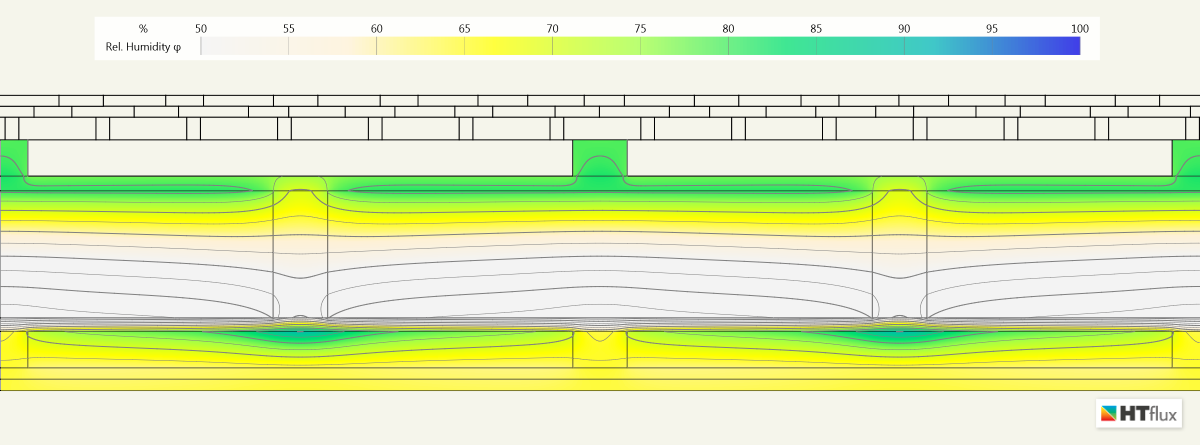
Relative humidity: due to the thermal bridging effect of the beams the humidity is elevated on the interior side of the OSB panel. However, under the conditions considered, no condensation is shown.
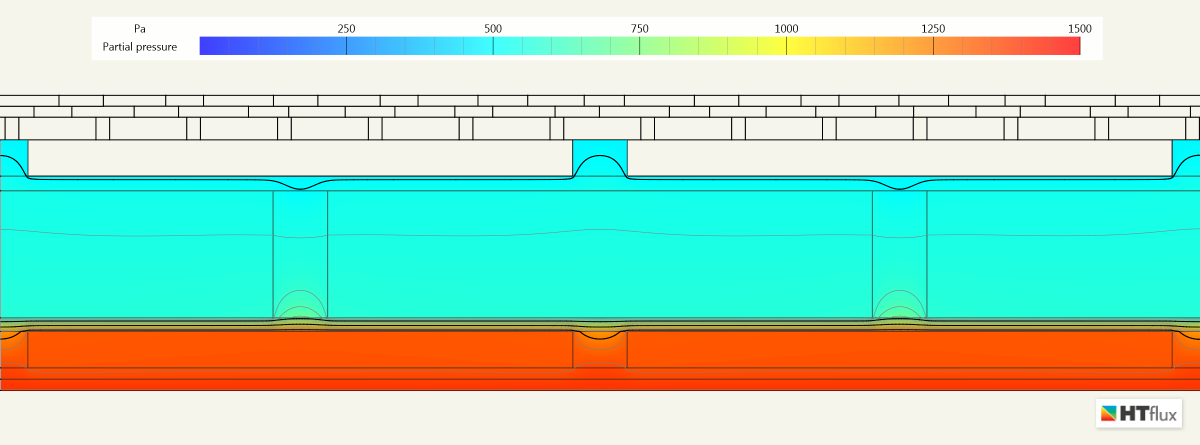
Water vapor partial pressure: the vapor retarding function of the OSB panel can be seen very well.
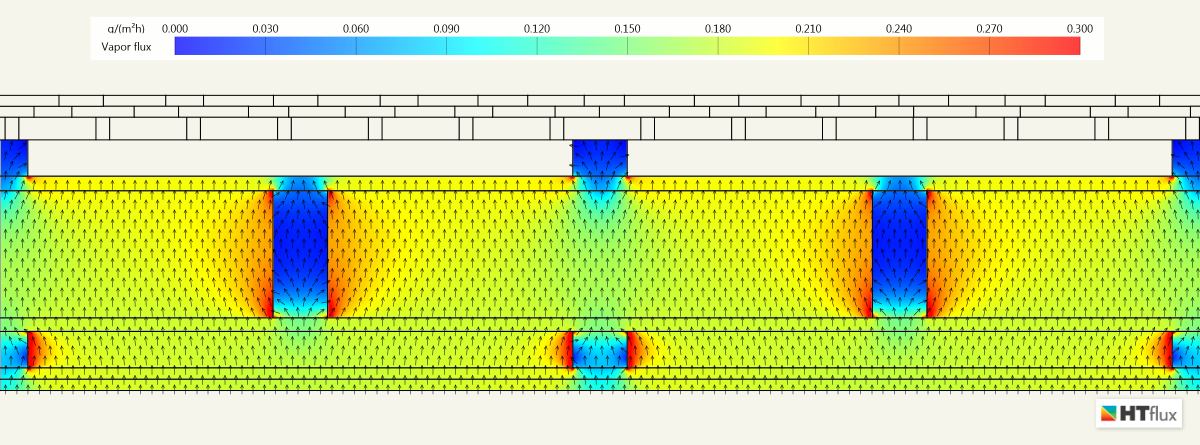
Vapor flux: most of the vapor diffusion takes place within the mineral-wool parts.
Author: DI Daniel Rüdisser, HTflux
Note: You are permitted and encouraged to use images from this page or to set a link to this page, provided that authorship is credited to “www.htflux.com”.