In this classical building physics example HTflux has been used to carry out damage analysis. An external wall had shown significant formation of mould. Reviewing the constructions plans reveals that the planner of the building intended to lessen the impact of thermal bridging by fitting 3cm XPS interior insulation at the base area of the affected wall.

Photo showing interior insulation at time of construction and mold formation after one year

Construction plan of the affected wall
A first GLASER 2d Simulation of the relvant detail provides interesting results:
- The fitting of the interior indeed increases the minimum surface temperature of the wall in such a way that the level required by the according standard is satisfied. From this point of view the trick with the interior insulation has worked.
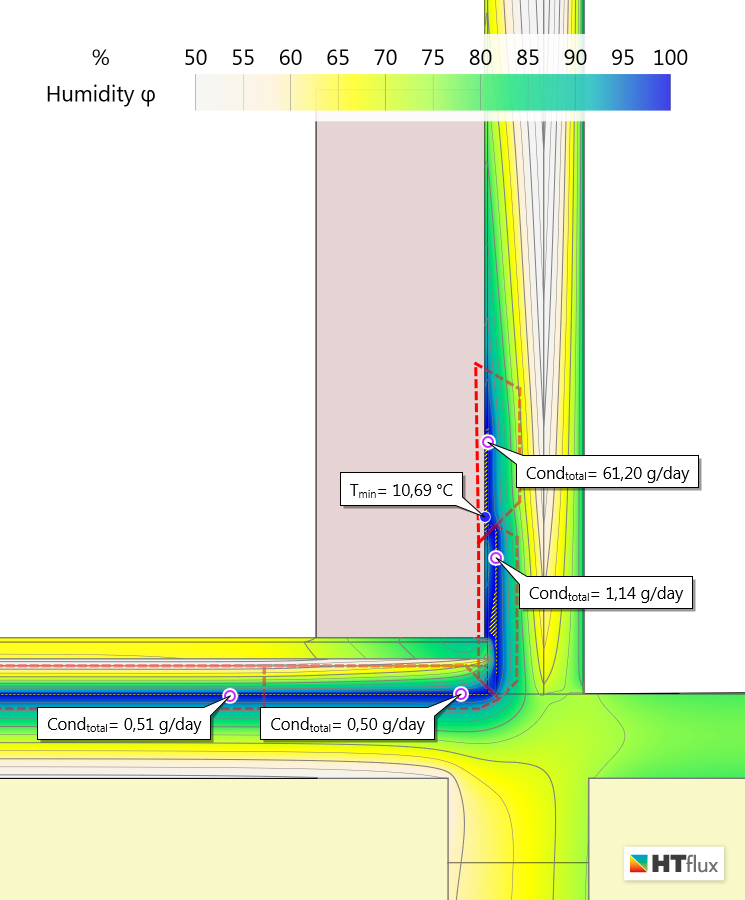
- The simulation shows condensation behind the XPS insulation panels, however the level of condensation is acceptable as this amount can easily be absorbed by the concrete.
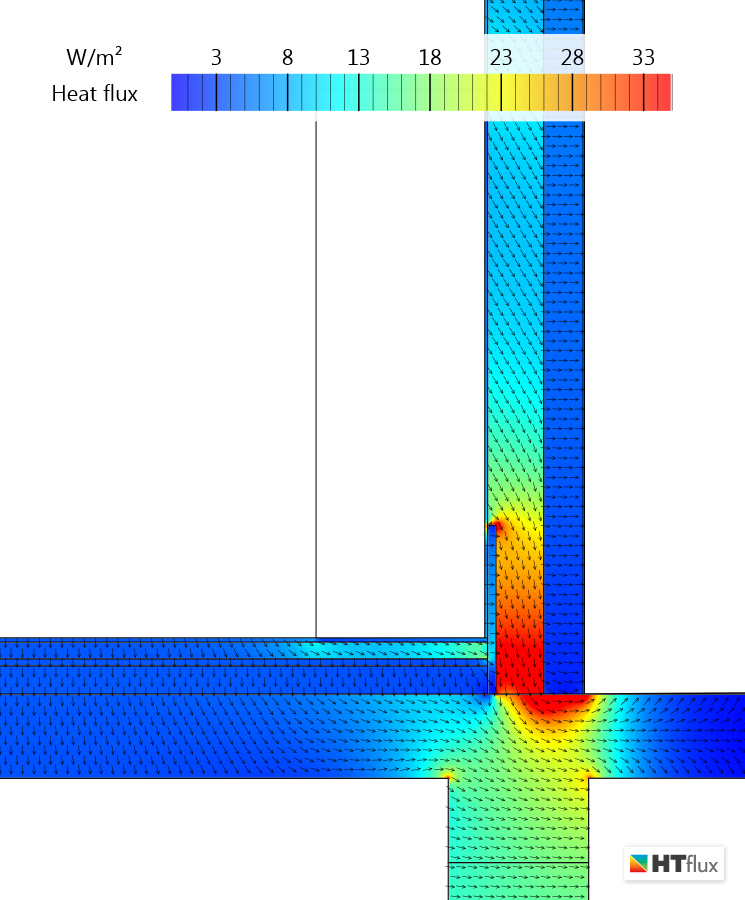
- The heat flux view however clearly demonstrates the thermal bridge is still very active. Only the low temperatures at the base of the wall have increased.
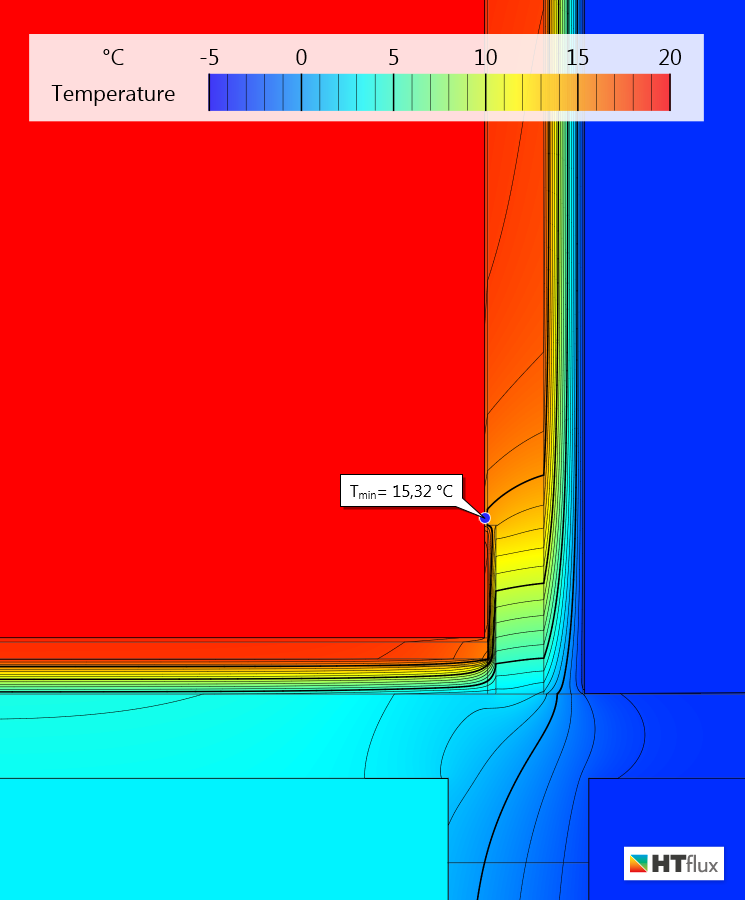
Temperature view – January
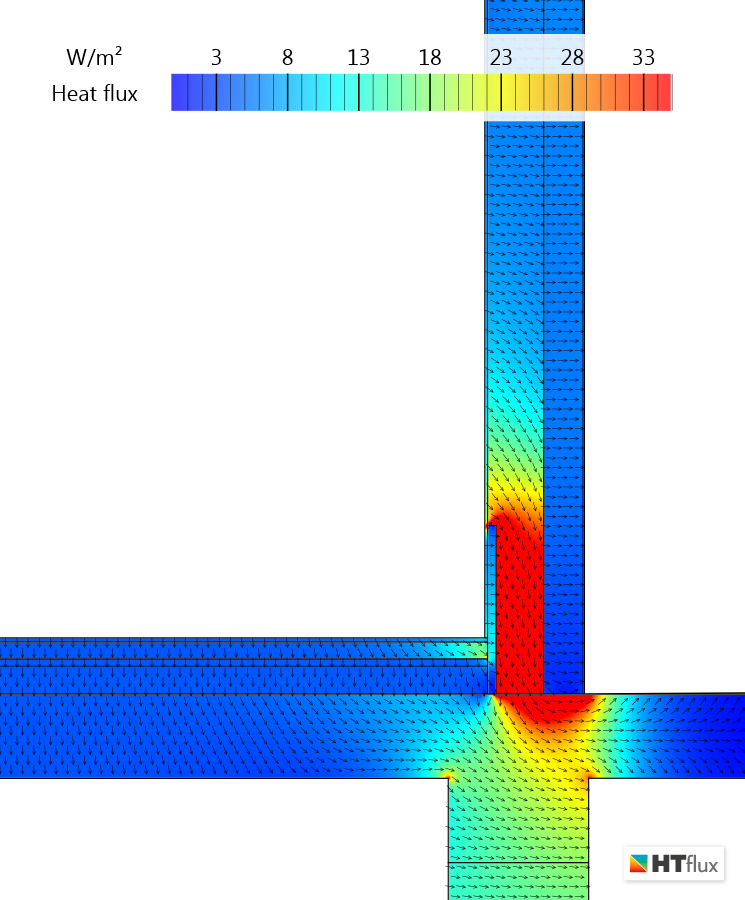
Heat flux – January
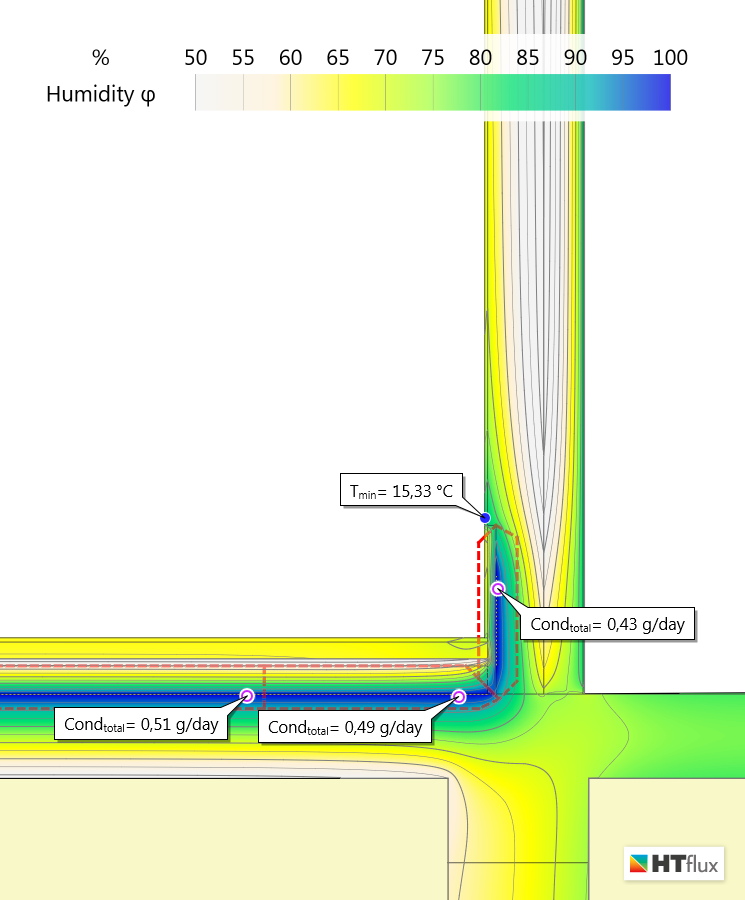
Relative Humidity – GLASER 2d
This first simulation does not yet explain the formation of mold on the wall. Further investigation reveals that a closet was covering most of this wall. That naturally means that the heat transfer to the wall is strongly reduced. Heat transfer through air convection and radiation are only possible to a very limited extent. To reflect this situation a new rectangular object with the dimensions of the closet is drawn into the simulation. The object is assigned as a climate boundary condition having the same interior temperature of 20 degrees but an increased thermal transfer resistance of 1,0 m²K/W. The real value is depending on various parameters however this value is suggested by the German DIN Fachbericht 4108-8 related to the according standard. The dimensions of the new object reflect the size of the real cupboard.
This adjusted simulation leads to quite different results:
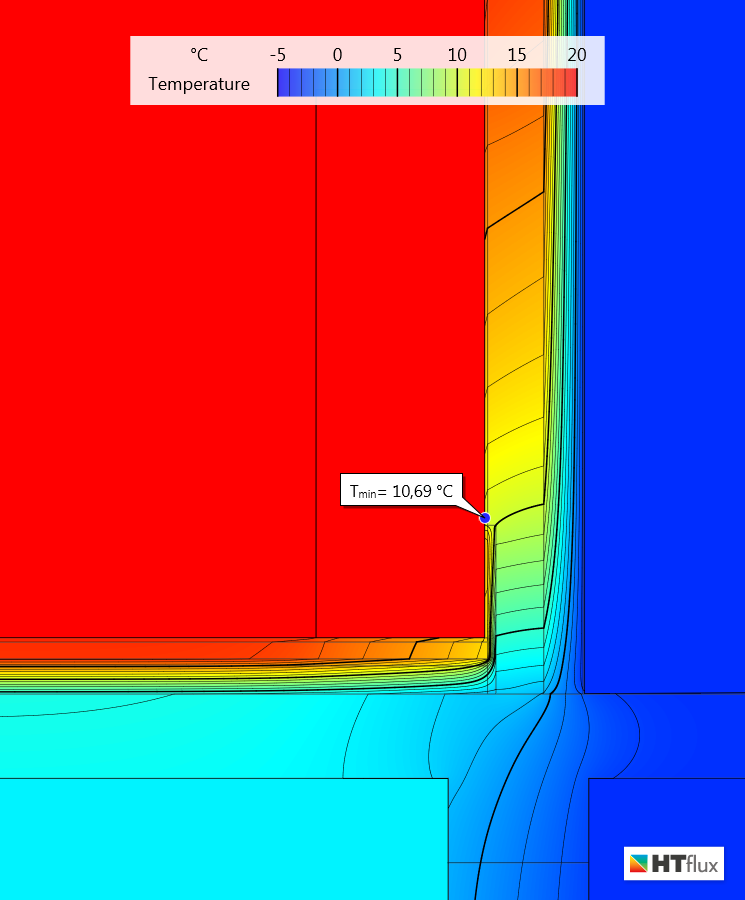
Temperature view with closet
Heat flux view – with closet
Relative Humidity – with closet
The combination of the unresolved thermal bridge and the reduced heat transfer to the surface of the wall now leads to dramatically lowered temperatures across the wall. Temperatures drop below the dew point on an approx. 40cm wide area starting right above the interior insulation. In the base area where the insulation is located the surface temperatures are higher and no mold formation can be observed (see photo). This mold pattern can be explained by the simulation very well.
N.b. the quantification of the condensation in this surface area is not reliable as the Glaser method is only able to predict the amount of condensation inside of building elements. The amount of condensation occurring on surfaces is dependent on many parameters such as volumetric flow, temperature and humidity of the surrounding air. Temperatures below the dew point on wall surfaces have be avoided in any case.
Note: You are permitted and encouraged to use images from this page or to set a link to this page, provided that authorship is credited to “htflux.com”.