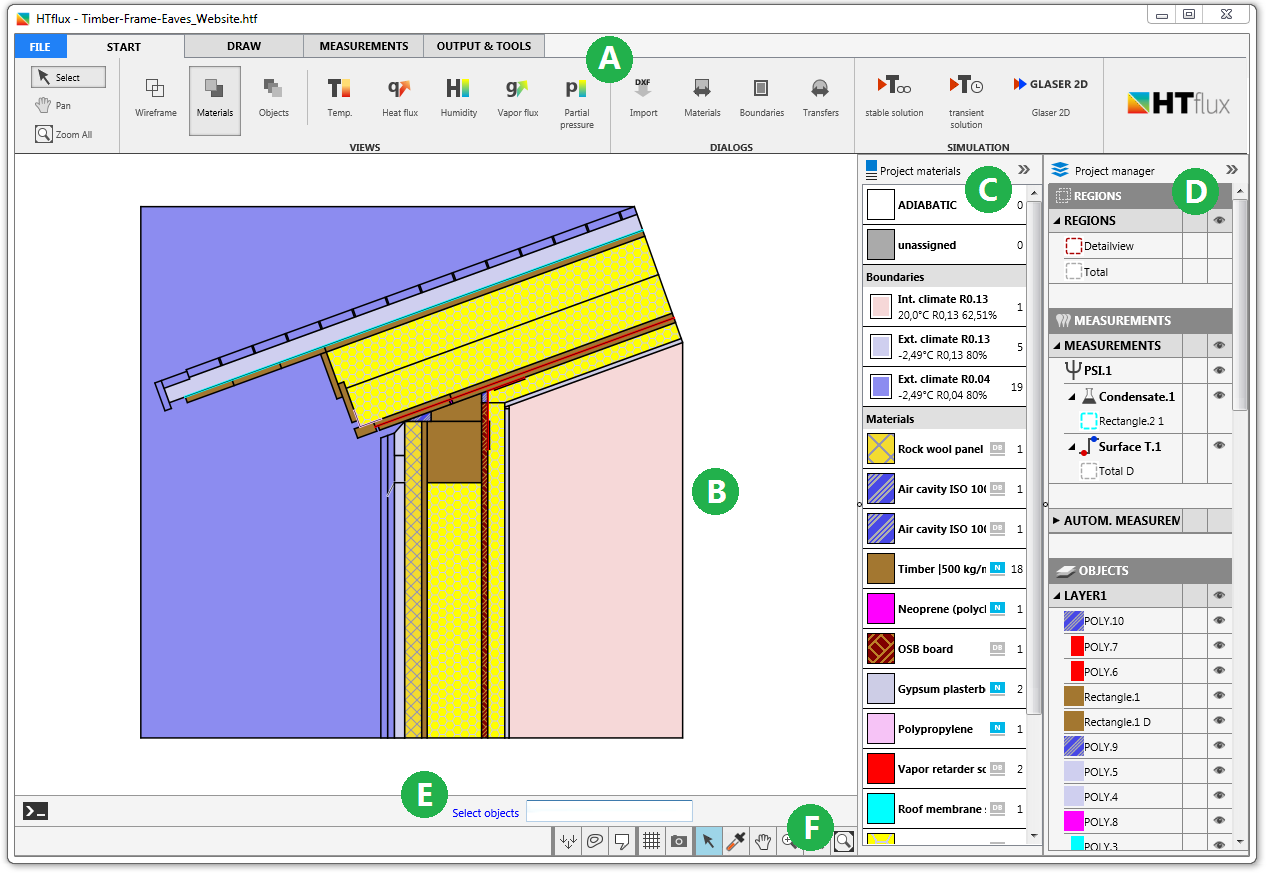
HTflux user interface
A – Main toolbar
B – Graphics window
C – Project materials list
D – Project manager
E – Command line
F – Quick-Toolbar
The HTflux user interface
A – Main toolbar

On the top side of the program you will find the main toolbar. It gives you acces to all the functions of the program. For clear arrangement the toolbar is divided into five menus that you choose with the buttons on the very top:
- File: gives you acces to the standard file functions (save, open, close…)
- Start: contains the most import functions for processing and viewing simulations
- Draw: containts the drawing and geometric editing functions
- Measurements: containts the measurement features
- Output & tools: contains reporting and additonal functions
B – Graphics window
In the center of the program you will find the main graphics window that will show you a graphical representation of your model or simulation data. You can change the type of view at any time using the View Buttons in the main menu. More about views can be found under “Simulation views“.
C – Project materials list
see specific page Project materials list
D – Project manager
see specfic page Project manager
E – Command line Below the graphics window you will find the command line bar. The command bar is important when you work with drawing, editing or measurement functions. It will always tell you the state of the current tool function and will also give you a hint on the possible mouse or keyboard entries.
F – Quick-Toolbar
![]()
At the very bottom of the program window you will find a menu with small buttons that will allow you to easily access certain functions at any time. The buttons cover overlays, grid and snapping settings as well as functions that are used often. The quick toolbar will show different options based on the view mode or function selected.